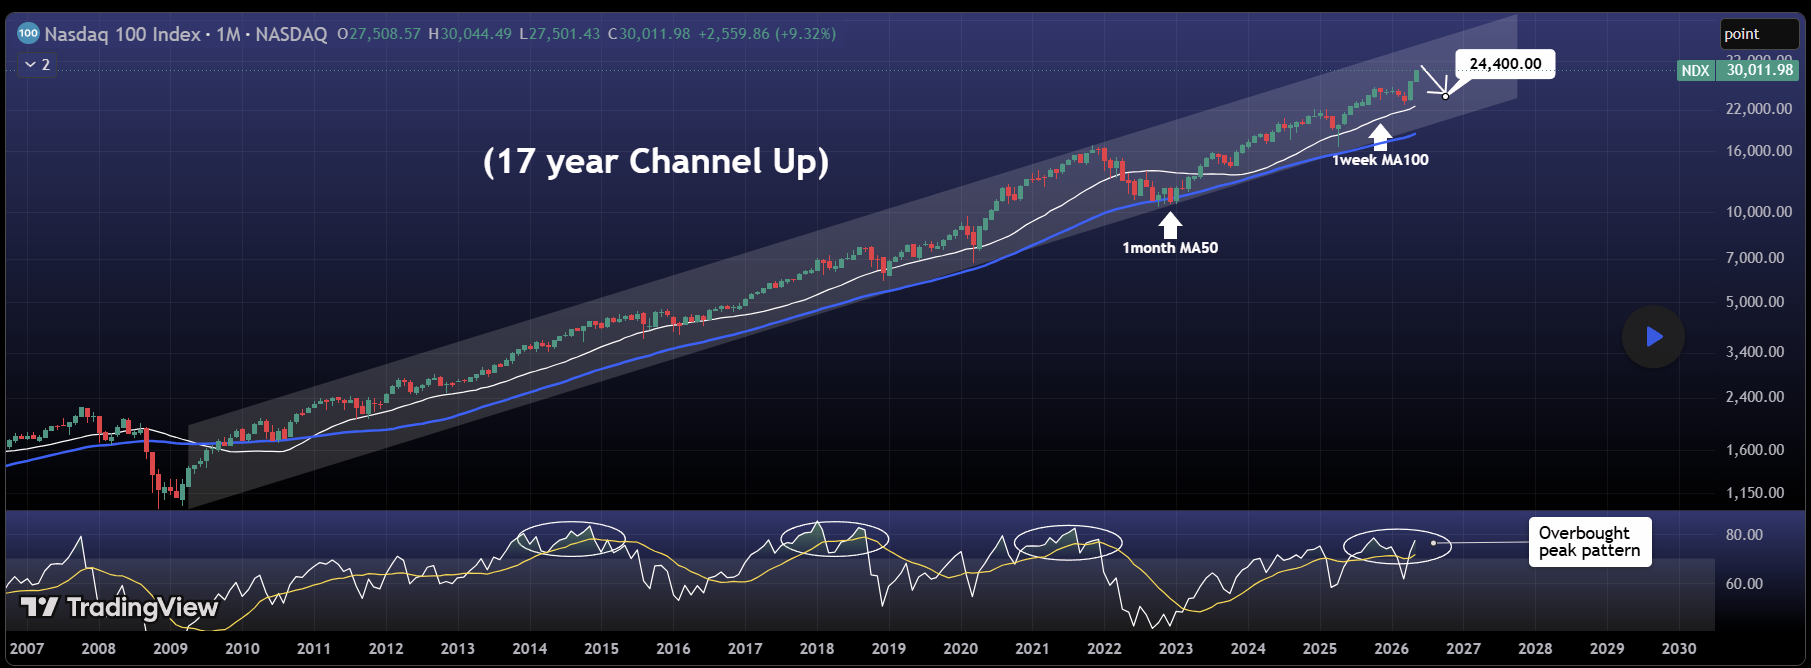
The Nasdaq has traded inside an upward channel for roughly 17 years.
That alone is interesting.
What may be more interesting:
Markets repeatedly convince participants that structural patterns no longer matter…
until they matter again.
Trend Structure
Visible chart structure shows:
• Long-term 17-year ascending channel
• Persistent higher highs and higher lows
• Major corrections repeatedly recovering near key moving averages
• Uptrend remains intact despite cyclical drawdowns
Importantly:
The primary trend has not broken.
Every correction shown eventually returned to upward structure.
Support / Resistance
Visible areas on chart:
Potential support zone:
• Region near 24,400
• Area aligns with previous reaction point highlighted
Dynamic support:
• 1 week MA100
• 1 month MA50
Both have historically participated in larger corrections.
Upper resistance:
• Upper boundary of long-term ascending channel
Price remains elevated within structure.
Moving Averages
Visible MAs:
• 1 month MA50 ≈ 18,309
• 1 week MA100 ≈ 22,650
Observations:
Historical pullbacks repeatedly interacted with these averages before trend continuation.
Recent structure remains:
Price above both major moving averages.
Long-term momentum remains constructive.
Indicators Visible
RSI(14):
Current RSI:
≈ 77
Interesting observation:
Multiple prior peaks on chart display similar RSI behavior and are highlighted as:
“Overbought peak pattern”
This does not automatically imply reversal.
But historically, elevated RSI conditions appeared near periods of increased volatility.
Chart Pattern
Primary visible pattern:
17-Year Channel Up
The remarkable aspect is not that the channel exists.
It’s that markets have respected it through:
• Financial crises
• Inflation shocks
• Rate hikes
• Banking stress
• AI enthusiasm
Narratives changed.
Structure largely remained.
Bullish Scenario
Bullish continuation would require:
• Channel support remains intact
• Price stays above major moving averages
• Long-term trend persistence continues
Current structure still favors continuation until invalidated.
Bearish Scenario
If historical overbought conditions repeat:
Potential reaction zones shown include:
24,400 support
alongside:
• 1 week MA100
• 1 month MA50
No reversal confirmation visible.
Only elevated conditions.
Perhaps the uncomfortable observation is this:
Investors often assume long-running trends become fragile precisely because they have lasted so long.
Yet some trends survive far longer than consensus expects.
The Nasdaq has done so for nearly two decades.
Do you believe current RSI conditions signal another major cooling phase — or is this simply another pause inside a 17-year trend