For years, many investors assumed Ethereum would eventually reclaim structural leadership against Bitcoin.
The chart currently suggests otherwise.
At least for now.
Trend Structure
Visible structure shows:
• Persistent lower highs since the 2021–2022 peak
• Repeated inability to sustain rallies
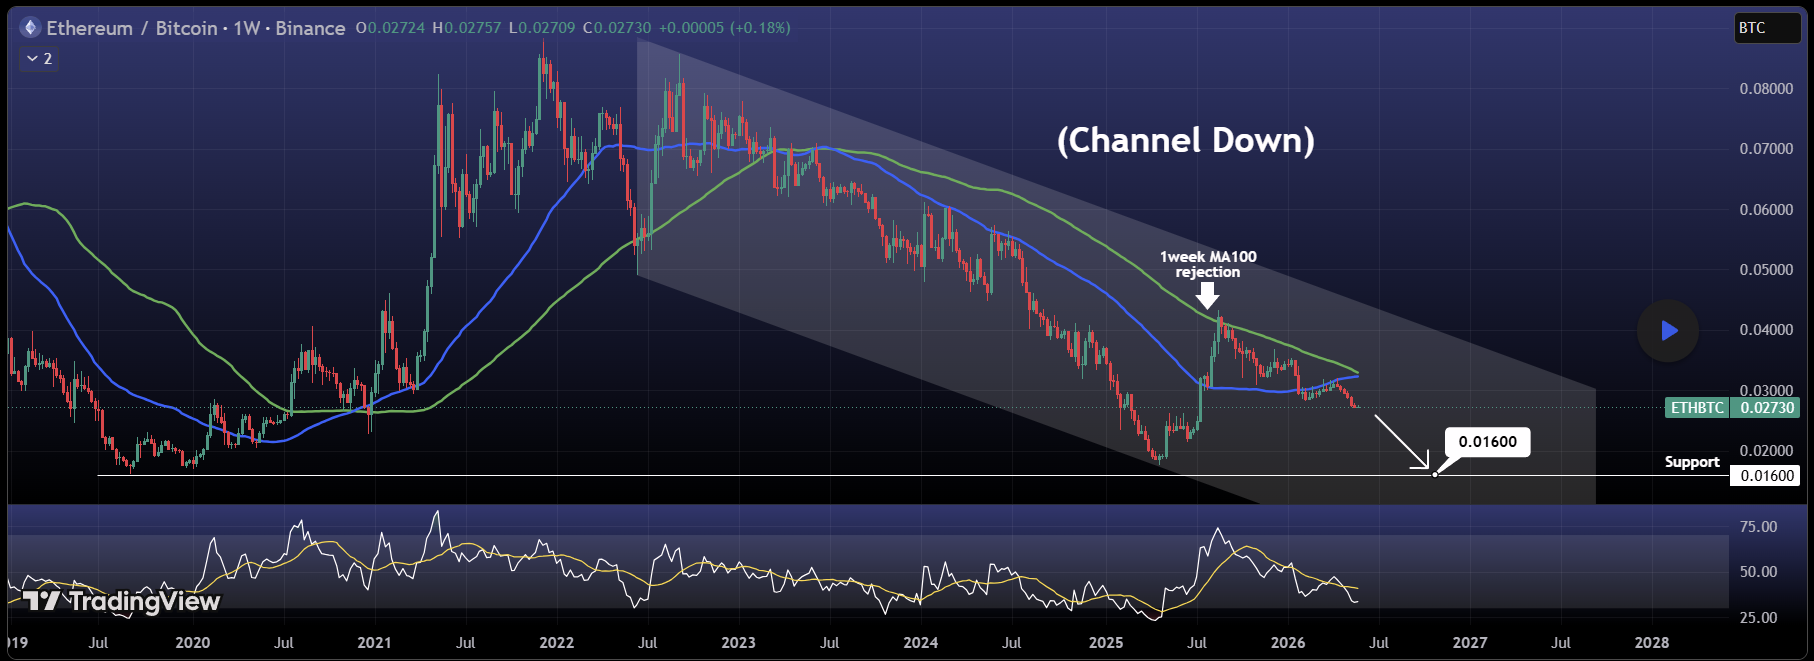
• Long-term descending channel remains intact
• Relative weakness versus Bitcoin continues
This is not a short correction.
The chart reflects a multi-year downtrend.
And importantly:
The trend has not broken yet.
Support / Resistance
Visible levels on chart:
Major Support:
• Horizontal support around 0.01600
• Lower boundary region of descending channel
This appears to be the major downside level highlighted.
Overhead Resistance:
• Descending channel resistance
• Area around moving averages
Price remains trapped beneath both.
Moving Averages
Visible MAs:
• 50 MA ≈ 0.03227 (blue)
• 100 MA ≈ 0.03293 (green)
Observations:
• Price trades below both major moving averages
• Previous rally attempt resulted in visible:
“1 week MA100 rejection”
That rejection preserved bearish structure.
Until price reclaims these averages, trend pressure remains downward.
Indicators Visible
RSI(14):
• RSI near 33–41 zone
• Momentum remains weak
• No clear bullish reversal signal visible
ETH/BTC appears closer to exhaustion than strength.
Yet oversold conditions alone rarely end trends.
Chart Pattern
Primary pattern:
Channel Down (Descending Channel)
The market has respected this structure for years.
Each relief rally has eventually failed inside the channel.
The pattern remains valid until broken.
Bullish Scenario
For bullish recovery:
• Price would need to reclaim moving averages
• Break above descending channel resistance
• Invalidate lower-high structure
No confirmation visible yet.
Bearish Scenario
If current weakness persists:
• Descending channel may continue guiding price lower
• Chart projection suggests possible revisit toward:
0.01600 support
That level appears increasingly important.
Not because support must hold.
But because markets often react where participants expect them to.
The uncomfortable question:
What if Ethereum isn’t becoming weaker…
What if Bitcoin is simply becoming stronger faster?
Relative performance can quietly reshape narratives over time.
Do you think ETH/BTC finally breaks this multi-year channel — or does 0.016 become the next major test?