
TL;DR Breakdown
- Algorand price analysis shows a bullish trend
- ALGO prices have shown resistance at $0.76 levels
- Support for ALGO/USD prices present at $0.72 levels
Algorand opened the daily market chart with an uptrend, reaching a high of $0.7652. The bulls have taken over and the price has increased to $0.7685, at the time of writing. This marks a 2.49% increase in price and signals a bullish market sentiment. ALGO prices are hovering at a range of $0.7275 and $0.7725, with a 24-hour volume of $1,191,859. A break above the $0.76 mark could see ALG test the resistance at $0.7725 in the near future. The current resistance is seen at $0.7652 and a break below this could see the price retrace to $0.75 levels in the short term.
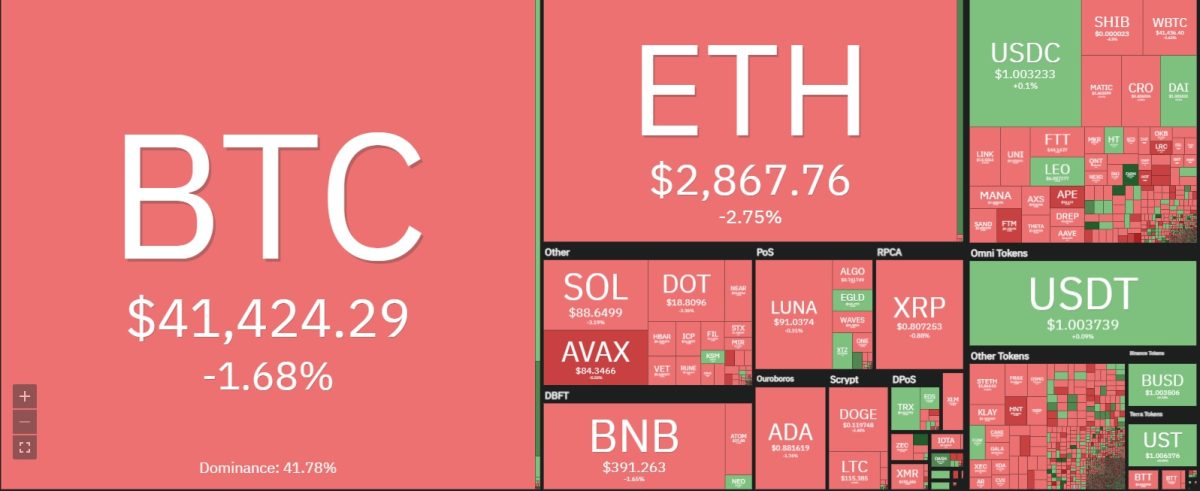
Algorand price analysis on the Coinmarketcap reveals an intraday high of $0.7686 and a low of $0.7460, which the price has been holding above since the market opened today. The 24-hour trading volume is at $33,511,303 and the market capitalization is at $772,221,687.Algorand is currently dominating the market with a 2.51% share ranking at position 29 overall
Algorand price analysis on a 1-day price chart: Bulls have established a firm uptrend
The 1-day price chart for Algorand reveals a market in an uptrend with the bulls in control. The MACD indicator is showing a bullish crossover and the RSI indicator is moving above. The Relative Strength Index (RSI) is at 62 levels, which indicates a neutral market. The MACD shows a bullish crossover, with the price currently trading above the 21-day EMA. The Parabolic SAR has turned bullish as well, with the dotted markers placed below the candlesticks.
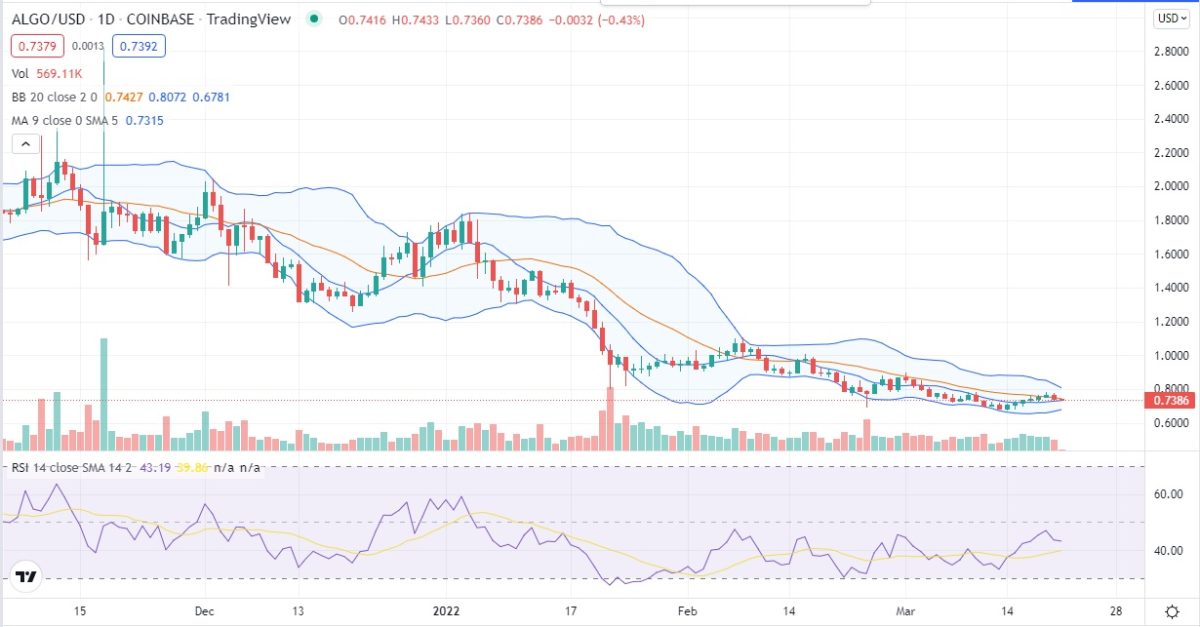
Overall, the Algorand price analysis shows the market is bullish in the short term, with prices expected to test the $0.7725 resistance levels in the near future. A break below $0.75 could see the price retrace to $0.7460 support levels. The RSI is at 62 levels, which suggests that the market is in a healthy state. The Bollinger bands are opening up, which indicates that the market is opening up for further volatility. A break above $0.7725 could see prices test the $0.7850 resistance levels in the coming days.
Algorand price analysis on 4-hour chart: Bulls are in control, but a pullback is expected
The 4-hour price chart for ALG shows that the bulls are in control of the market, with prices holding above the 21-day EMA. The RSI is at 58 levels, which suggests that there is some bullish momentum but a pullback could be seen soon. The MACD is in a bullish crossover and the Parabolic SAR is below the candlesticks, indicating a bullish trend.
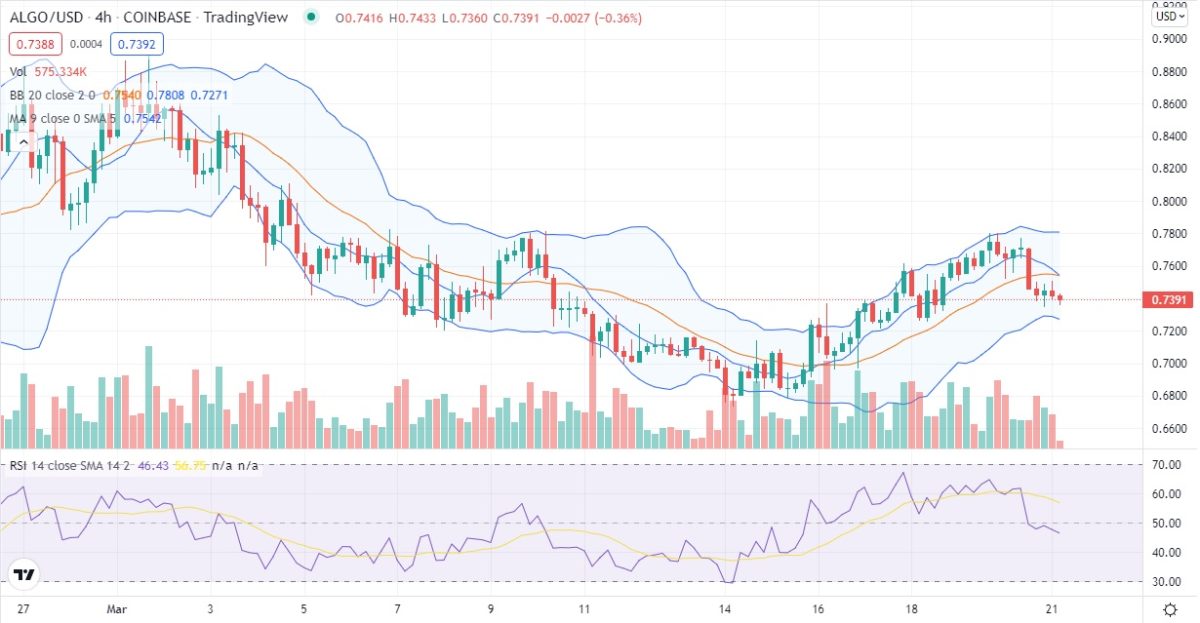
The Bollinger bands are starting to contract, which shows that the market could be headed for a pullback. The prices have reached the upper band and could see a retrace to the lower band soon. A break below $0.75 could see prices retrace to $0.7460 levels in the near future.
Algorand price analysis summary
The Algorand price analysis shows the market is currently in a bullish trend, with prices testing the $0.7725 resistance levels. A break above this could see prices test the $0.7850 resistance levels in the coming days.
A pullback to the $0.75 support levels is expected in the near future, with a break below this could see prices retrace to $0.7460 levels. The MACD indicator is in a bullish crossover and the RSI indicator is at 58 levels, which suggests that there is some bullish momentum but a pullback could be seen soon.


