
TL;DR Breakdown
. Avalanche price dropped 3 percent over the past 24 hours . Price dropped below $16 again after recovering on March 17 . Further decline in place for $13 price point
Avalanche price analysis continues to show a bearish trend in place, as price dropped another 3 percent over the past 24 hours to move down to $16. After initially recovering from this price point on March 17, AVAX has remained unable to challenge up to the $18 resistance point. Successive bearish candlesticks can be observed on the daily chart, after a brief period of sideways movement. Meanwhile, the token could be tipped for a decline down to the $13 mark over the current trend, just below the $14.41 support.
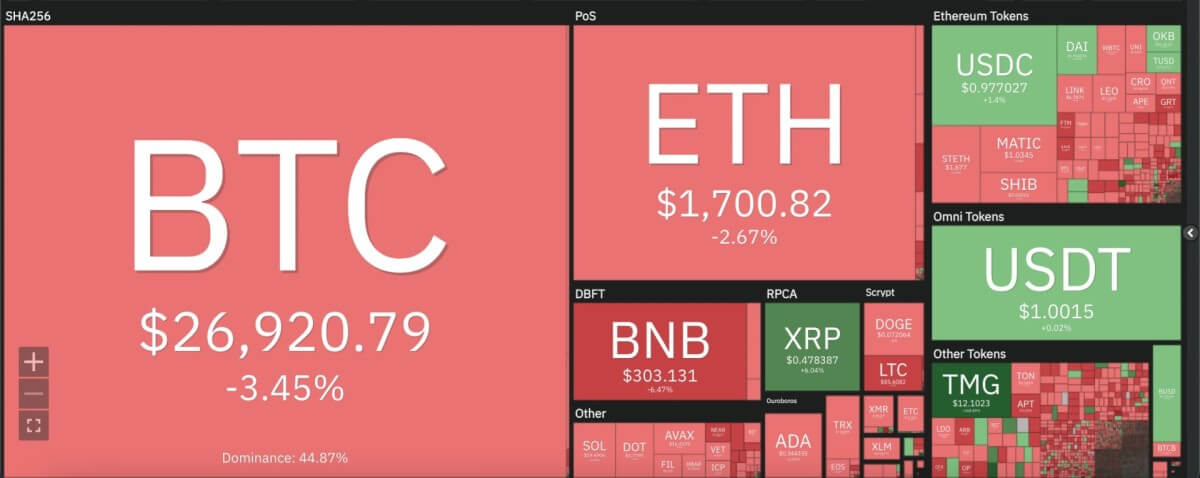
The larger cryptocurrency market also showed similar signs of decline across the board, as Bitcoin slipped down below the $27,000 mark with a 4 percent drop. Ethereum followed suit, dipping 3 percent to $1,700. All leading Altcoins showed similar output over the past 24 hours, apart from Ripple, that rose 6 percent to $0.47. Dogecoin dropped 2 percent to stay at $0.07, whereas Cardano also stayed at $0.34. Meanwhile, Polkadot dropped 3 percent to move down to $5.77.
Avalanche price analysis: Bearish technical indicators seen in majority on daily chart
On the 24-hour candlestick chart for Avalanche price analysis, price can be seen slipping down once again after a brief period of recovery over last week. AVAX price dropped down to $16 over the past 24 hours, with support currently found at the $14.5 mark. With yesterday’s downtrend, price finds itself just below the 9 and 21-day moving averages on the daily chart, along with the important Exponential moving average (EMA) at $16.75.
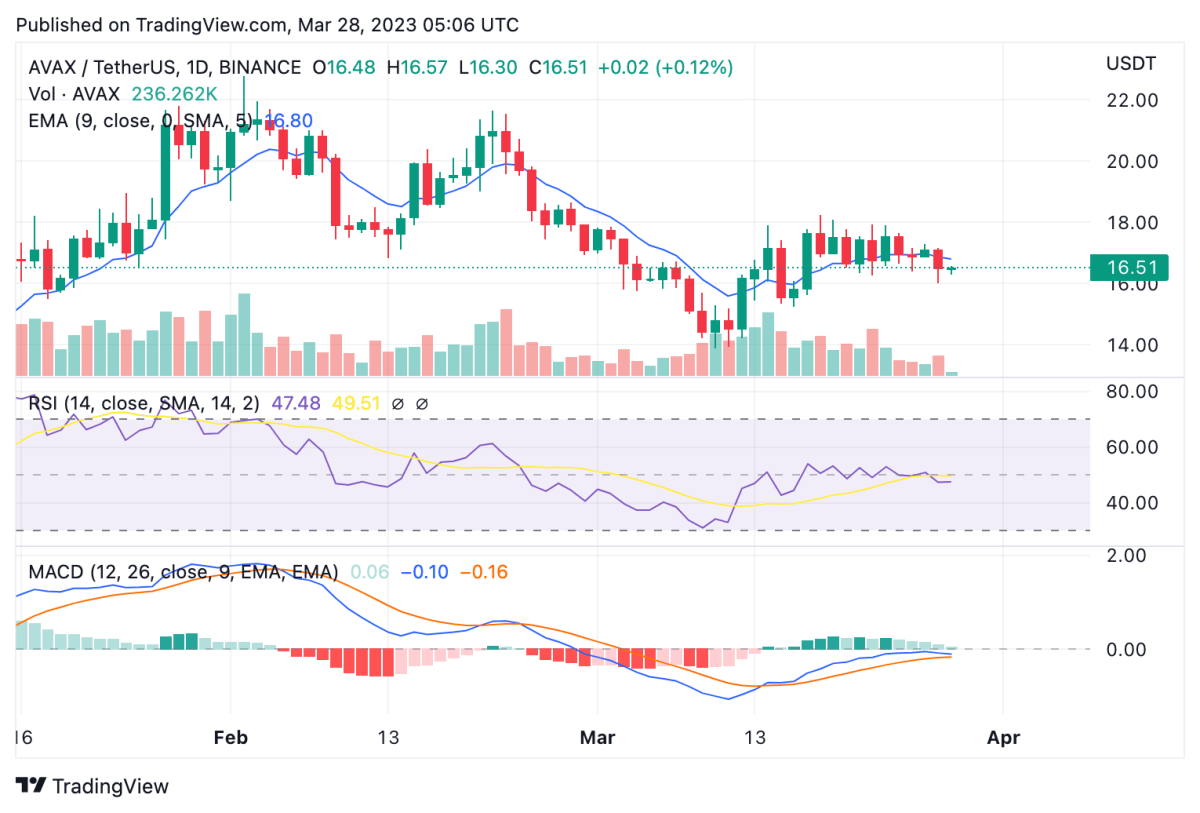
The 24-hour relative strength index (RSI) can also be seen oscillating in a downward direction to move towards the oversold zone with current reading at 47.54. Meanwhile, the moving average convergence divergence (MACD) curve can also be seen posing a bearish divergence, with the trend line just about to diverge below the signal line.


