
What Is Technical Analysis?
Technical analysis is the study of price movements on charts to predict future market behavior.
Instead of focusing on company fundamentals or economic data, technical analysis looks at price, volume, and patterns to identify trading opportunities.
The core idea is simple:
market prices move in trends, and history tends to repeat itself.
This approach is widely used in:
- stocks
- forex
- cryptocurrencies
- commodities
Why Technical Analysis Works
Technical analysis works because markets are driven by human behavior.
Fear, greed, and market psychology create patterns that tend to repeat over time.
When many traders react similarly to price movements, recognizable structures begin to form on charts.
These patterns help traders:
- identify trends
- anticipate reversals
- find entry and exit points
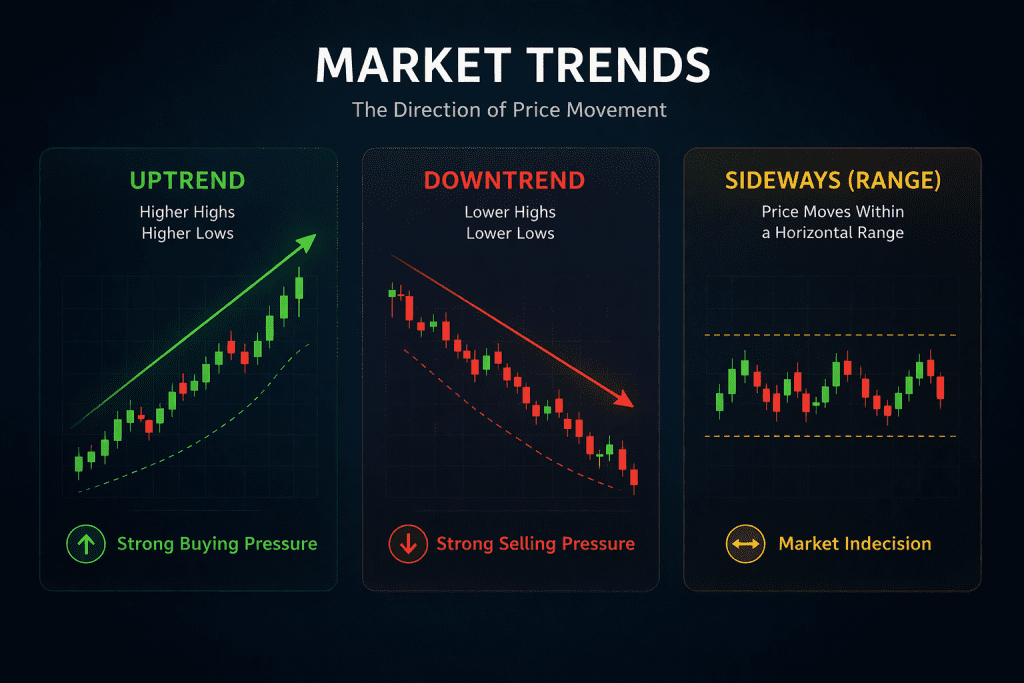
Understanding Market Trends
A trend is the general direction of the market.
There are three main types:
Uptrend
Higher highs and higher lows
Indicates strong buying pressure
Downtrend
Lower highs and lower lows
Indicates strong selling pressure
Sideways (Range)
Price moves within a horizontal range
Indicates market indecision
Identifying the trend is the first step in any technical analysis strategy.
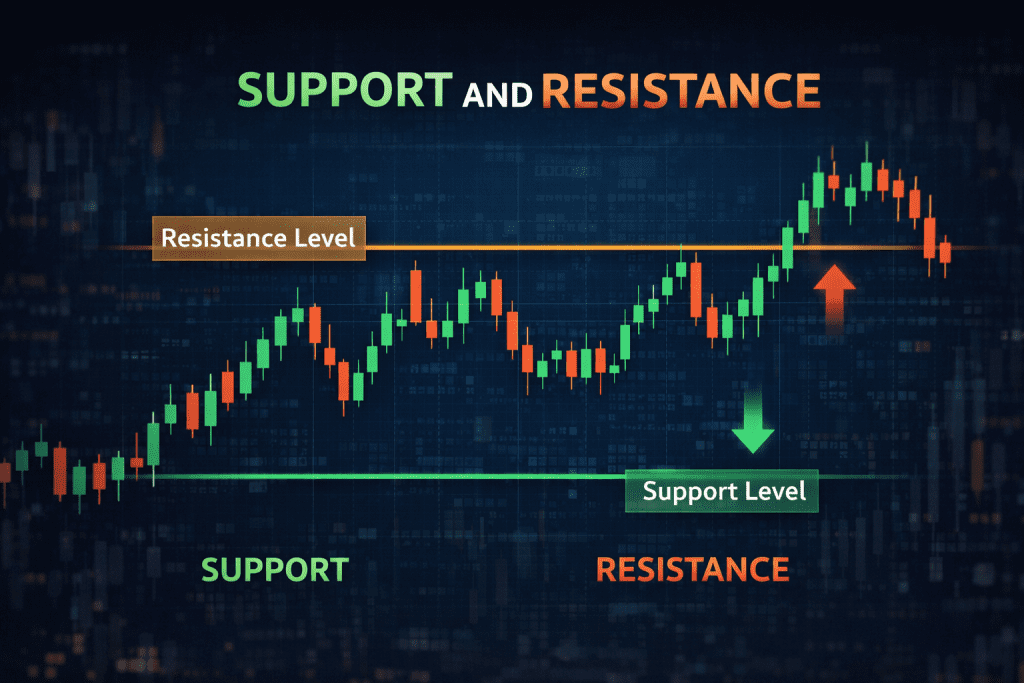
Support and Resistance Levels
Support and resistance are key concepts in technical analysis.
Support
A price level where demand is strong enough to stop the price from falling further
Resistance
A level where selling pressure prevents the price from rising higher
These levels act as decision zones where traders look for opportunities.
Popular Technical Indicators
Indicators are tools that help traders analyze price data.
Some of the most widely used include:
Moving Averages
Show the average price over time and help identify trends
RSI (Relative Strength Index)
Measures whether an asset is overbought or oversold
MACD (Moving Average Convergence Divergence)
Helps identify momentum and trend changes
Indicators should be used as confirmation, not as the sole basis for decisions.
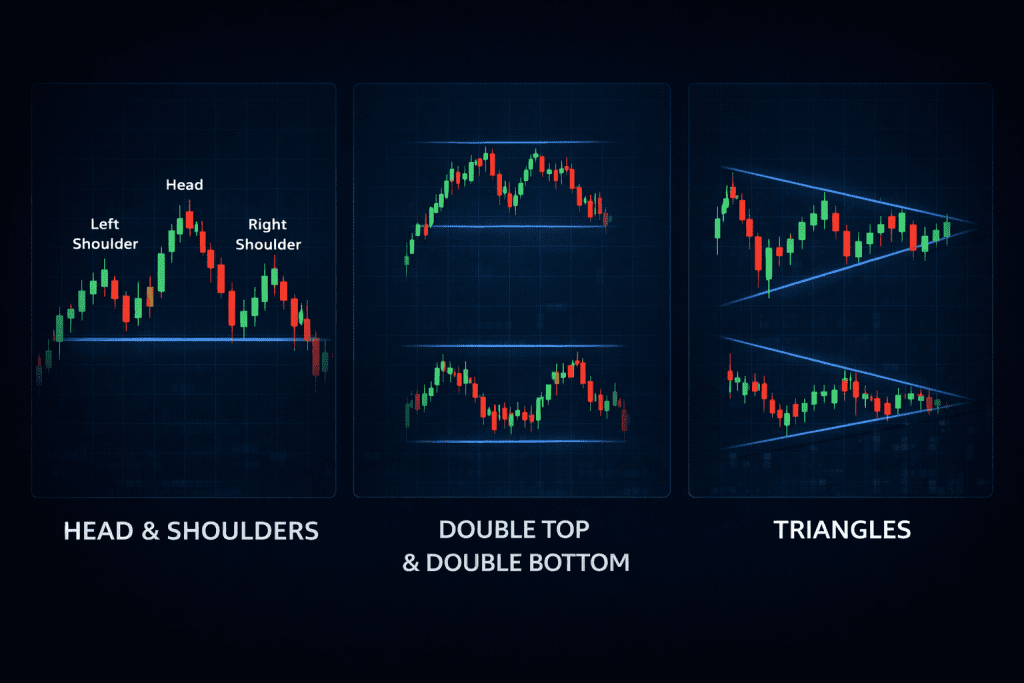
Chart Patterns Every Beginner Should Know
Chart patterns are formations that appear on price charts and signal potential market movements.
Common patterns include:
- Head and Shoulders (trend reversal)
- Double Top / Double Bottom
- Triangles (continuation patterns)
- Flags and Pennants
These patterns help traders anticipate what might happen next.
Risk Management in Technical Trading
Even with strong analysis, risk management is essential.
Key rules include:
- always use stop-loss orders
- avoid risking too much on a single trade
- maintain a favorable risk-to-reward ratio
- stay disciplined
Technical analysis improves probabilities, but it does not guarantee outcomes.
Common Mistakes to Avoid
Beginners often make avoidable mistakes:
- relying on too many indicators
- ignoring the overall trend
- overtrading
- making emotional decisions
Keeping your strategy simple is often more effective.
Final Thoughts
Technical analysis is a powerful tool that helps traders understand market behavior through charts and patterns.
By learning how to identify trends, key levels, and patterns, you can make more informed trading decisions.
Over time, consistency and discipline matter more than complexity.
Mastering the basics of technical analysis is the first step toward becoming a more confident and effective trader.


