XRP has experienced a surge of over 10%, with its current price standing at $2.35. During this period, the market recorded $14.15 million in XRP liquidations. As the new year begins, analysts are closely monitoring assets with bullish patterns, and XRP has captured attention despite being stuck in a prolonged consolidation phase, struggling to break the $3 threshold.
Recently, XRP has shown signs of recovery, moving upwards. The altcoin climbed by 10.35%, reaching a daily high of $2.44 before settling at $2.35 at the time of writing. The ongoing bullish momentum hints at the possibility of further gains.
Additionally, Coinglass data reveals that $14.15 million worth of XRP was liquidated in the market, while its daily trading volume stands at $10.48 billion.
Meanwhile, John E. Deaton highlighted that despite being the third-largest cryptocurrency by market cap, XRP remains underappreciated. He also noted that XRP ended December on a positive note, displaying resilience and growth amid market volatility.
Can XRP Maintain Its Momentum?
The four-hour chart of XRP suggests a bullish trend. Breaking through the $2.44 resistance level could trigger further upward movement, with a potential target of $2.50. If the bullish phase strengthens, XRP might embark on a more robust uptrend.
Conversely, if the positive trend reverses, XRP risks falling below the $2.34 support level. Failure to hold this position could lead to a decline to $2.28 or lower, marking a significant price drop.
Technical analysis indicates a bullish signal, with the Moving Average Convergence Divergence (MACD) line positioned above the signal line, suggesting a potential price increase and an entry opportunity for long positions.
Moreover, the Chaikin Money Flow (CMF) indicator stands at 0.22, reflecting strong buying pressure and a positive money flow. XRP’s trading volume has also increased by over 122%. 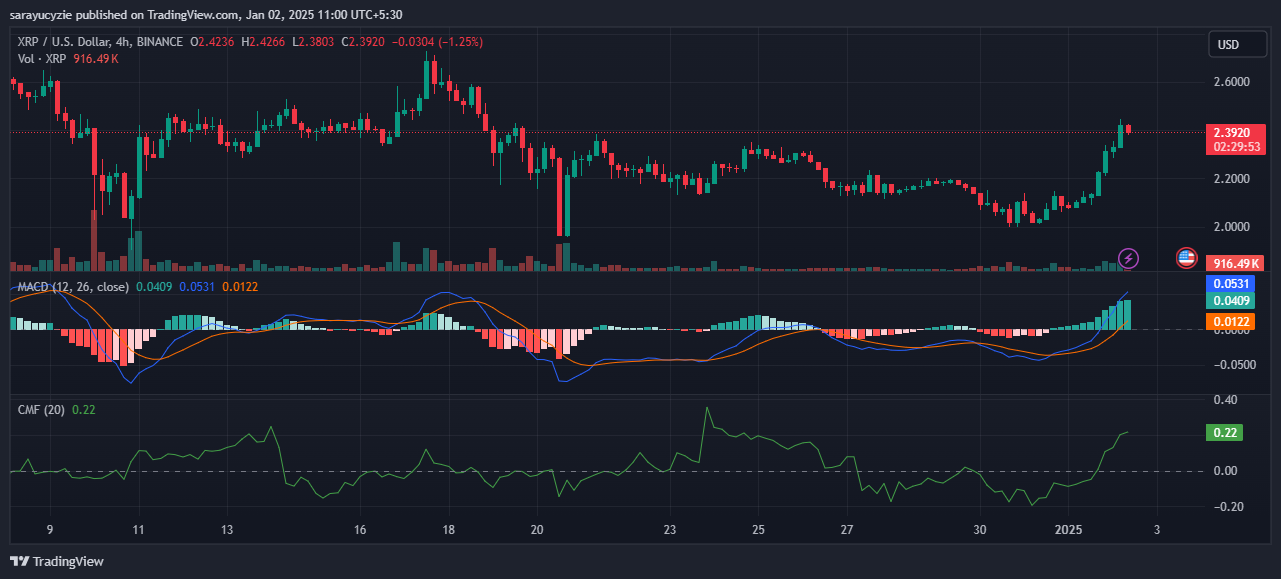
In the short term, the 9-day moving average surpassing the 21-day moving average further supports the bullish sentiment. Additionally, XRP’s Relative Strength Index (RSI) of 68.18 indicates the asset is nearing the overbought zone.
Disclaimer
The opinions expressed in this summary are solely those of the author and should not be considered investment advice. Readers are encouraged to conduct their own research before making investment decisions.


