
ADA Nears Key Breakout Amid Symmetrical Triangle Pattern Formation
Market indicators and on-chain data reveal mixed signals, reflecting overall indecision.
Cardano (ADA) has faced market turbulence, with traders exercising caution despite recent attempts to push higher. After reaching a two-week high of $0.3711, ADA encountered renewed selling pressure, dropping 4.24% to $0.3443 over the past 24 hours. Additionally, trading volume has declined by 39%, further indicating market hesitation.
A significant technical pattern to watch is the symmetrical triangle on ADA’s daily chart, suggesting a major price move is on the horizon. Currently trading at around $0.3585, down 0.80% at the time of writing, ADA is nearing a critical breakout point. A move above the triangle’s upper trendline could trigger a rally, but this will require strong buying momentum and increased trading volume to confirm the breakout.
Several technical indicators highlight the market’s indecisiveness. The Relative Strength Index (RSI) sits at 46.96, placing ADA in neutral territory. Meanwhile, narrowing Bollinger Bands indicate reduced volatility, with the upper band at $0.3969 serving as key resistance. For a bullish breakout, ADA’s RSI must rise above 50, accompanied by stronger buying momentum.
What’s Next for ADA?
On-chain data presents a mixed perspective. Net network growth remains slightly positive at 0.09%, but a 0.53% drop in large holder concentration hints at bearish sentiment. On a positive note, the “In the Money” metric shows that 3.43% of ADA holders are currently profitable, offering a mildly bullish outlook. Whale activity, indicated by large transactions, remains neutral. The 9-day EMA at $0.3443 supports the prevailing bearish trend.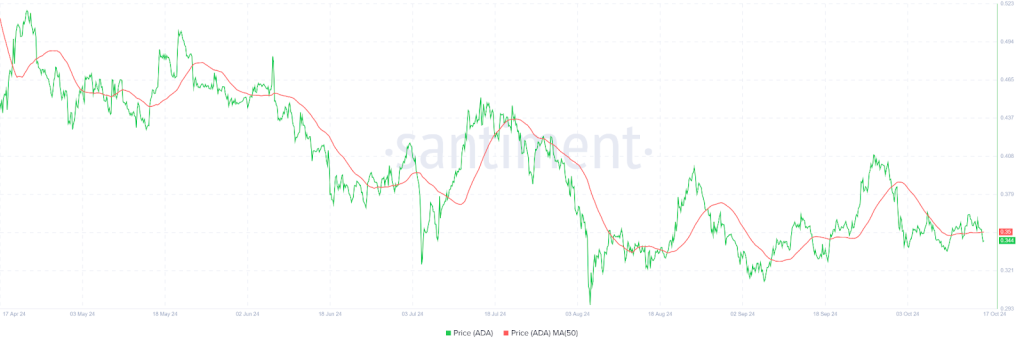
While ADA’s technical setup suggests a potential price shift, the direction depends on greater market participation and sustained social momentum. A rally toward $0.40 is possible but would require overcoming resistance levels and attracting broader investor interest.


