Arbitrum’s rounding bottom pattern suggests a potential bullish reversal, with significant resistance at the $1 mark. EMA and MACD indicators indicate continued upward momentum for ARB.
Currently trading at $0.899 after a slight 0.70% intraday decline, Arbitrum (ARB) recently reached a six-month high of $0.9521, demonstrating resilience amidst market pullbacks. Over the past month, ARB has surged by an impressive 71%, with trading volumes jumping 77% in the last 24 hours.
The ARB price chart forms a rounding bottom, also known as a saucer bottom—a strong signal of a long-term shift from bearish to bullish sentiment. Investors are watching key resistance levels at $0.9747 and $1.9006, with critical support at $0.6558 and $0.4723.
On the technical front, ARB has surpassed the 200-day EMA and breached the 23.60% Fibonacci retracement level at $0.86. A bullish engulfing candle on November 5 initiated a 91% rally, pushing the price higher. The EMA indicators now favor bulls, with a potential golden crossover between the 50-day and 200-day EMAs pointing to sustained upward momentum.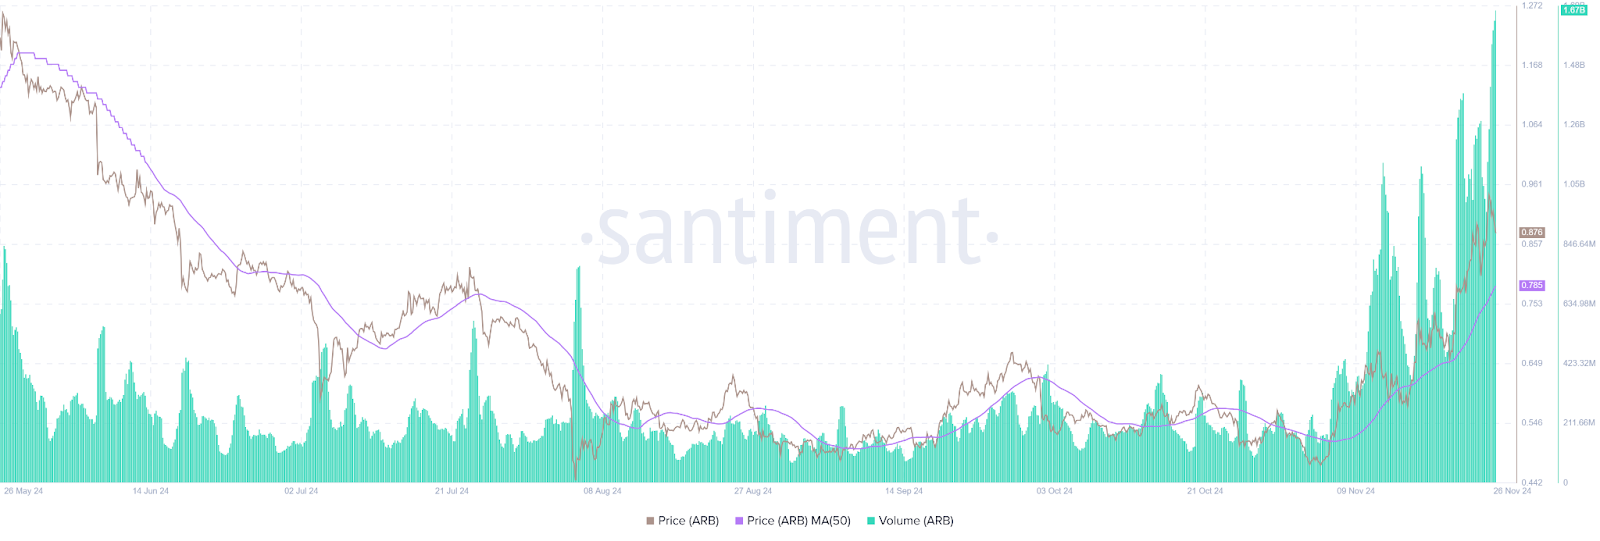
Will ARB Break $1?
MACD indicators show a steady rise in the MACD and Signal Lines, supported by growing bullish histograms, confirming ARB’s uptrend. However, analysts caution that a retest of the $0.86 Fibonacci level may occur before confirming further recovery.
The current rally aims to break the psychological resistance at $1 and potentially target the 78.60% Fibonacci level of $1.8679. If this pattern holds, ARB could achieve a 2x rally in December.
As the rounding bottom unfolds, investors are advised to monitor market dynamics and resistance levels closely. Will ARB sustain its bullish momentum and reach new highs, or encounter resistance ahead? Time will reveal the outcome.


