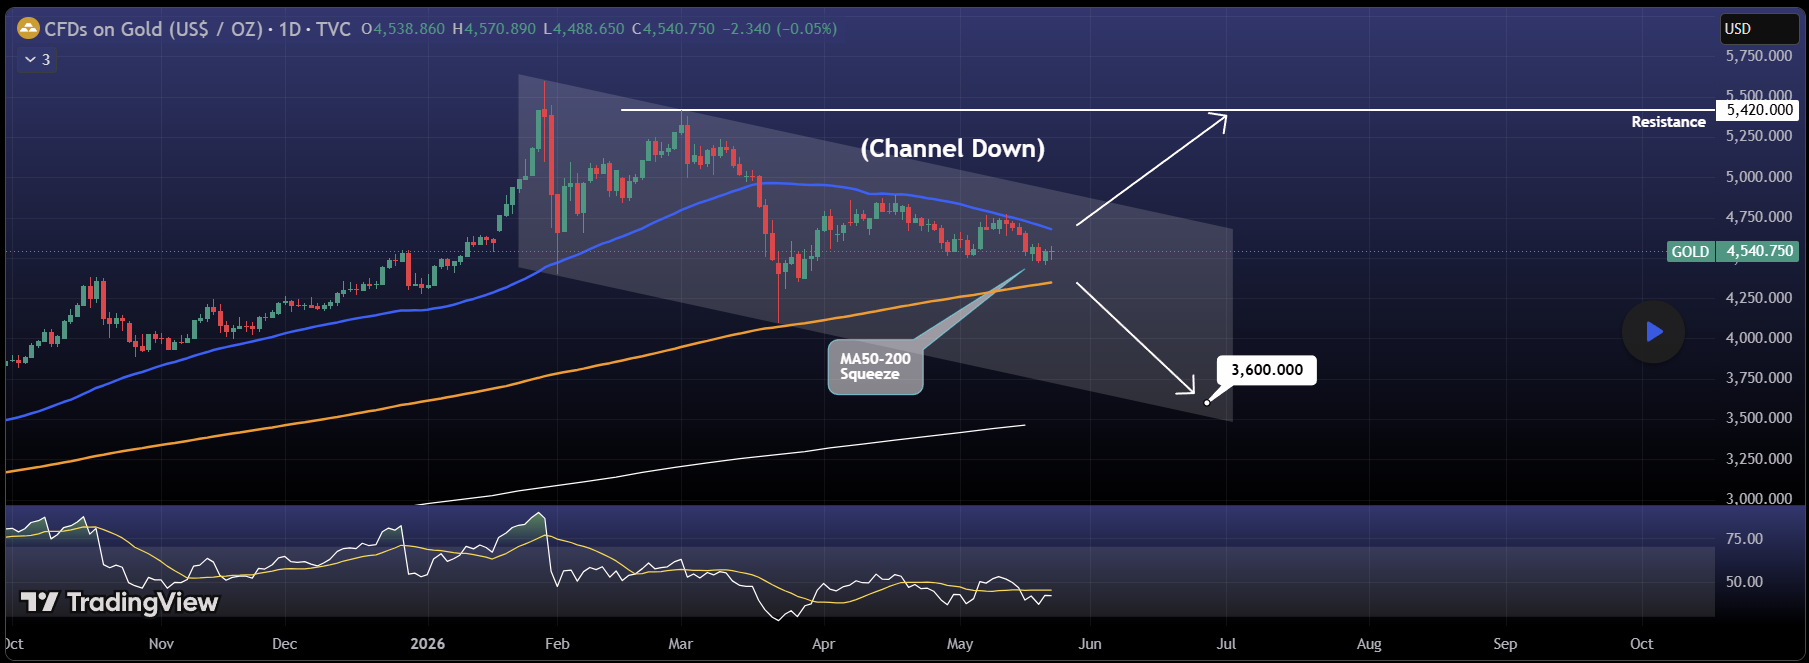
Gold remains compressed inside a descending channel while price sits between two major moving averages.
The structure is becoming interesting.
After failing to sustain highs near the upper boundary of the channel, Gold has continued printing lower highs while gradually approaching an area where the 50 MA and 200 MA are tightening.
Historically, periods of MA compression often precede expansion moves — although direction remains uncertain.
Trend Structure
The visible trend since the peak has been:
• Descending channel formation
• Lower highs maintained
• Price hovering near the lower half of the channel
• Longer-term trend support still present through the rising 200 MA
Current structure looks like consolidation inside weakness rather than confirmed reversal.
Support / Resistance Visible
Major Resistance:
• Channel breakout region
• Horizontal resistance around 5,420
Potential downside path shown on chart:
• Lower channel boundary
• Area highlighted near 3,600
These are projections shown directly on the chart rather than confirmed targets.
Moving Averages
Visible MAs:
• 50 SMA ≈ 4,678 → currently above price and acting as overhead pressure
• 200 SMA ≈ 4,346 → rising underneath price
• Weekly SMA (100) ≈ 3,462 → longer-term trend support below
Interesting observation:
The distance between the 50 MA and 200 MA is narrowing.
That squeeze may become important if volatility expands.
Indicators Visible
RSI(14):
• RSI near 42
• Momentum remains below neutral zone
• No obvious bullish momentum acceleration visible
Momentum appears cautious rather than aggressively bearish.
Chart Pattern
Primary pattern:
Descending Channel (Channel Down)
This often reflects corrective phases but can also become continuation structures.
Price remains inside the pattern.
No breakout confirmation yet.
Bullish Scenario
Bullish continuation would likely require:
• Reclaiming the 50 MA
• Breaking above channel resistance
• Moving toward the visible resistance near 5,420
That would invalidate near-term weakness.
Bearish Scenario
If channel support fails:
• Continued downside within structure remains possible
• Lower boundary projection shown on chart points toward the 3,600 area
Until breakout occurs, price remains trapped between both possibilities.
This is one of those structures where patience may matter more than prediction.
What do you think comes first for Gold — breakout toward 5,420 or continuation lower inside the channel?