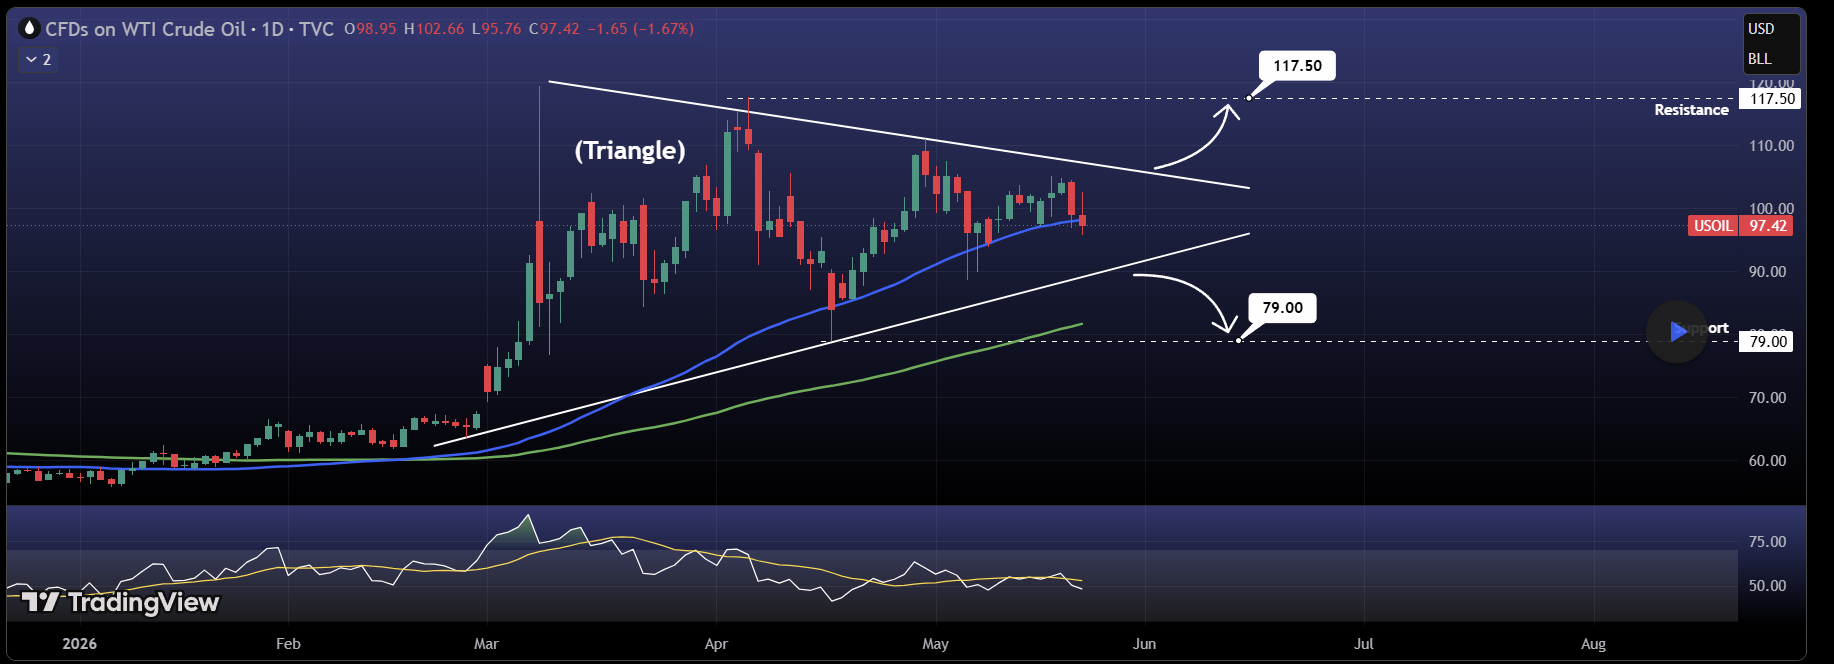
WTI Oil continues trading inside a tightening triangle while price hovers near key moving averages.
Compression phases like this often become more important as volatility contracts.
The market has repeatedly respected both ascending support and descending resistance, leaving price trapped in a narrowing range with directional uncertainty increasing.
The next move may depend less on prediction and more on which side of the structure finally gives way.
Trend Structure
Visible structure shows:
• Strong impulsive rally earlier in the year
• Followed by consolidation
• Series of lower highs beneath descending resistance
• Rising lows supported by ascending trendline
This creates a tightening equilibrium rather than a confirmed trend reversal.
Current market condition:
Neutral-to-compression phase inside a symmetrical triangle.
Support / Resistance
Visible key levels on chart:
Major Resistance:
• Triangle breakout area
• Horizontal resistance near 117.50
Major Support:
• Ascending triangle support
• Horizontal support near 79.00
Price remains between both extremes.
Neither side has confirmed control.
Moving Averages
Visible MAs:
• 50 SMA ≈ 98.15 (blue)
• 100 SMA ≈ 81.66 (green)
Observations:
• Price is trading around the 50 SMA
• 100 SMA continues trending upward beneath price
• Longer-term trend support remains constructive while above the 100 MA
MA structure still leans supportive despite short-term weakness.
Indicators Visible
RSI(14):
• RSI near 48
• Momentum sits below neutral zone
• No clear overbought or oversold conditions
Momentum appears balanced but slightly weakening.
Chart Pattern
Primary visible pattern:
Symmetrical Triangle
This reflects contracting volatility and indecision.
Triangles often resolve with stronger directional expansion once support or resistance breaks.
Breakout confirmation is not visible yet.
Bullish Scenario
Bullish continuation may require:
• Holding ascending support
• Reclaiming triangle resistance
• Break above structure
If confirmed, chart projection points toward:
117.50 resistance
Bearish Scenario
Bearish continuation could develop if:
• Ascending support fails
• Price loses triangle structure
Visible downside projection points toward:
79.00 support
Until then, compression remains dominant.
Markets often become most unpredictable right before they become directional.
Do you think Oil resolves this triangle higher toward 117.50 or lower toward 79.00?