Significant Ethereum whale transfers hint at potential sell-offs and repositioning. The Relative Strength Index (RSI) at 47.33 reflects a bearish sentiment, with chances of further declines. The global cryptocurrency market cap is currently at $2.28 trillion, showing a 5.96% drop in the last 24 hours. This downturn may be partly influenced by shifts in U.S. election sentiment, with recent data indicating Trump’s winning odds have decreased to 2.8%. This shift might be affecting market confidence, applying pressure on major cryptocurrencies like Ethereum.
Currently, Ethereum trades at $2,511.96, reflecting a 5% decrease over the past day, with a market cap of $302.46 billion, representing about 13.3% of the total crypto market. In the last 24 hours, ETH trading volume was $21.04 billion, down 3.9%, showing investor caution amid election-related uncertainties impacting the market.
Interest in Ethereum ETFs spiked this week, with inflows of $13.65 million, marking the highest level in the past seven days, contrasting with minimal inflows in Bitcoin ETFs. This trend suggests institutional investors are increasingly favoring Ethereum exposure, likely due to its unique role in decentralized finance and smart contracts. Despite short-term pressures, strong inflows into Ethereum ETFs highlight continued confidence in ETH’s long-term growth.
Whale Movements and Key Technical Levels for Ethereum
Recent large transactions by Ethereum whales have also affected the market. One significant transfer of 13,162 ETH (around $33.1 million) moved from an unknown wallet to Coinbase, potentially indicating a future sell-off. Another transfer of 20,000 ETH (approximately $50.4 million) from Bitfinex to an unknown wallet hints at strategic repositioning by major holders. These transfers can signal future price shifts, as large moves influence market liquidity and supply.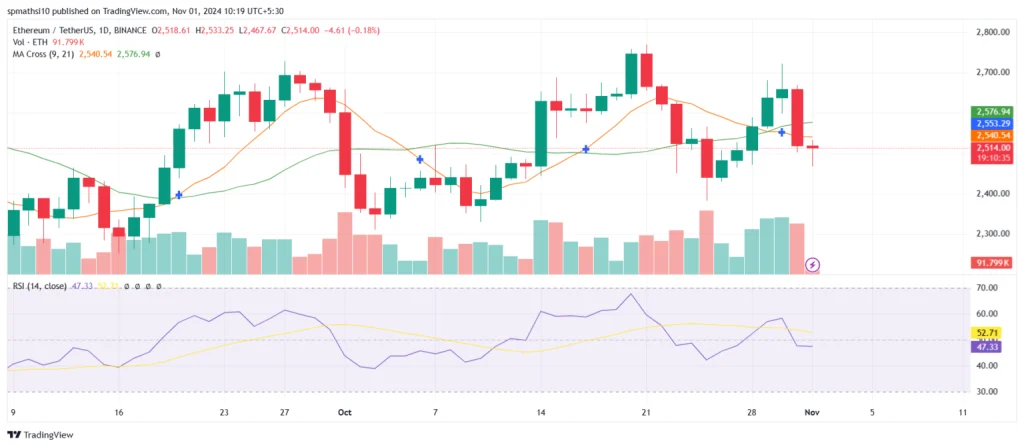
From a technical perspective, Ethereum’s current support level is at $2,514, with resistance at $2,576.94. Surpassing this resistance could push ETH toward $2,600, while a decline below support may bring further drops toward $2,467. The RSI currently stands at 47.33, below the average of 52.71, indicating a bearish outlook and possible selling pressure.
Additionally, the 9-day moving average (MA) at $2,540.54 has crossed below the 21-day MA at $2,576.94, forming a bearish crossover. This trend indicates further downside risk in the near term, as Ethereum may face challenges breaking resistance without a surge in buying momentum.


